An Introduction to DataWarrior
There's a rather large category of important chemistry software that doesn't get a lot of attention in journal articles. It inhabits the twilight zone between chemist and programmer. I don't mean "chemist" in the sense of cheminformatician or computational chemist. I mean "chemist" in the sense of a trained experimentalist who gathers and uses experimental data. A movement toward the adoption of pipelining tools (e.g., Pipeline Pilot and Knime) and notebooks (e.g., Jupyter Notebook) has been underway for many years now. However, these tools are designed with data wranglers in mind, not data producers. Today's article looks at Data Warrior, a software package closely aligned with the needs of experimentalists.
About DataWarrior
The homepage for Data Warrior describes it as: "An Open-Source Program for Data Visualization and Analysis with Chemical Intelligence." If you've worked with Spotfire® or Instant JChem, many of DataWarrior's features will be familiar. Here's a collection of links I found helpful when learning about DataWarrior:
- DataWarrior User Manual. A reference manual with hints of tutorial.
- DataWarrior Forums. An excellent source of information not found elsewhere. I found the Functionality and Cheminformatics subforums especially helpful. The search box in the top-right consistently returned results that I didn't see in Google.
- A Review of DataWarrior. Covers many features with lots of screenshots.
- Spotlight Interview with Dr Thomas Sander from Idorsia Pharmaceuticals. Interview with the head of drug discovery informatics at DataWarrior's corporate sponsor, Idorsia.
- DataWarrior Source Code Repository. Written in Java and GPL-licensed.
- DataWarrior: An Open-Source Program For Chemistry Aware Data Visualization And Analysis. Paper from 2015 describing DataWarrior's functionality and architecture.
Download & Install
Downloads are available for Linux, MacOS and Windows. On MacOS, installation was a simple matter of double-clicking the installer after validating the md5sum.
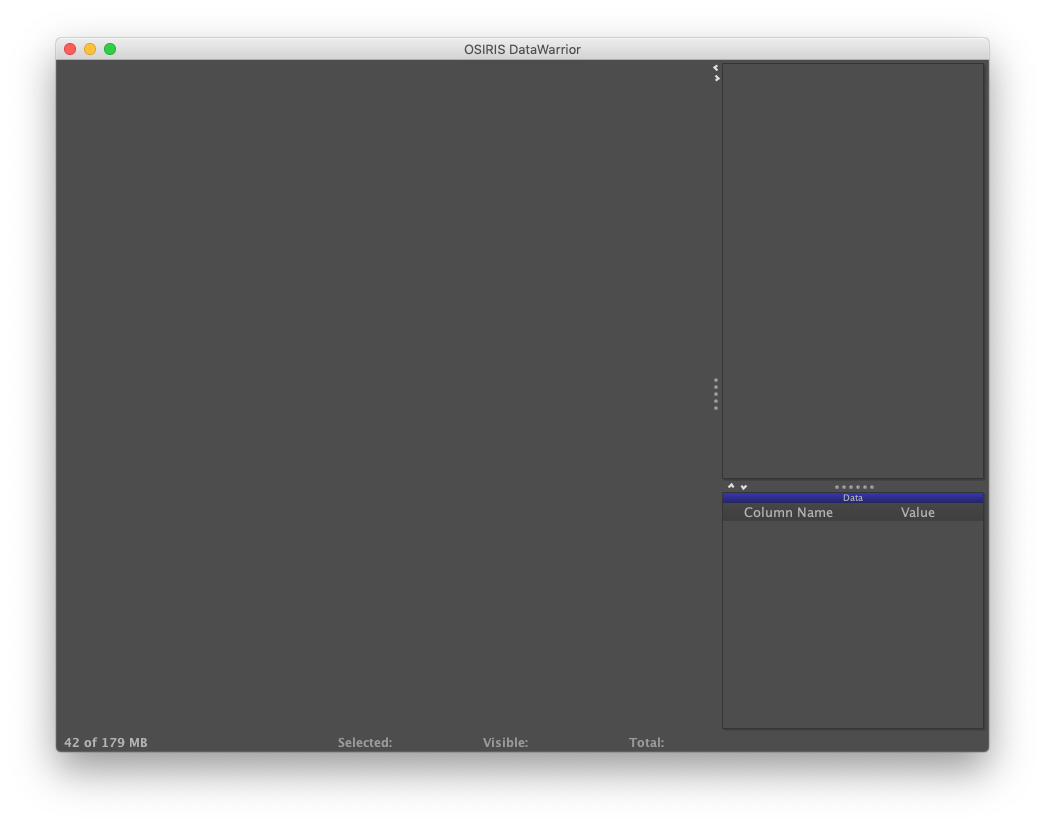
After launching DataWarrior, a rather blank looking screen is presented. This seems like an oversight because there's a lot of useful functionality just around this dark corner.
Tutorial
The DataWarrior installation includes a tutorial file (File>Open Tutorial File>FLT_3_SAR_FROM_CHEMBL.dwar), which I found useful for understanding what the software has to offer. A README file displayed by the user interface walks you through a series of things to do with the data set. Unfortunately, my copy of the README had several errors that prevented me from finishing. Fortunately, I was able to piece enough together to get this gist.
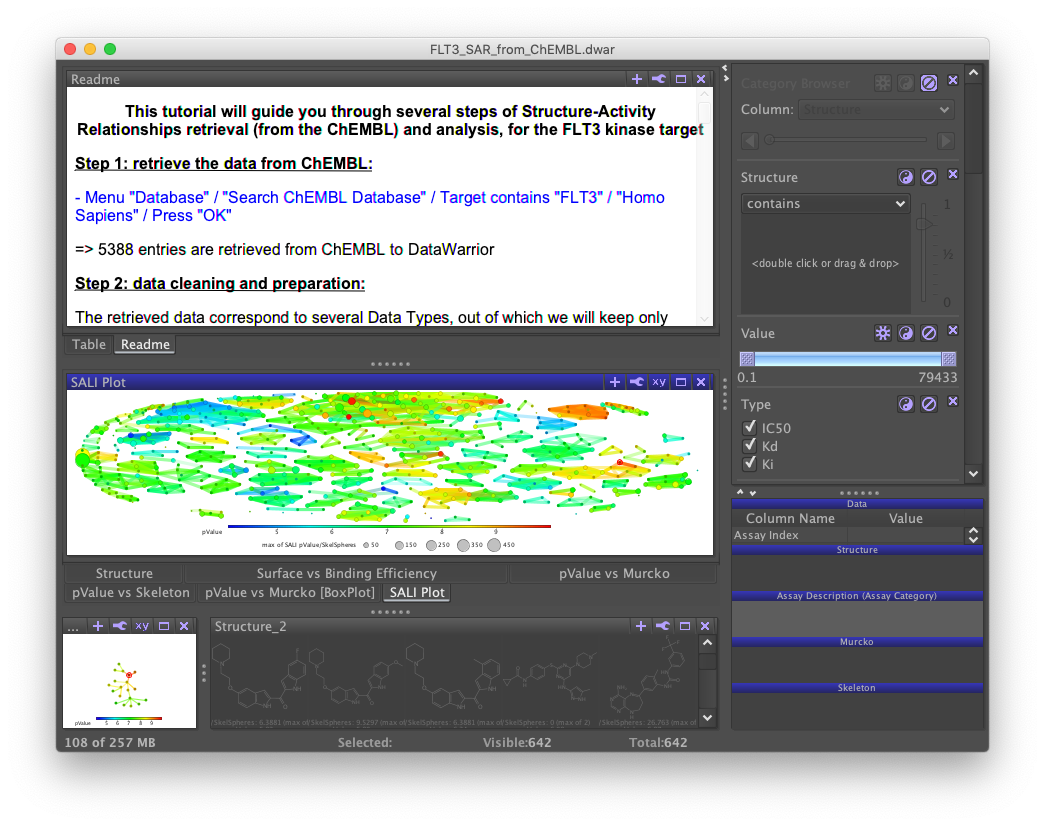
The main problem with this tutorial, and most of the documentation I found, was that it teaches how to work with existing files but not how to create one from scratch. Building a file from scratch is in my view a much faster way to understand the key concepts you'll need over and over when using DataWarrior.
Before we get started, a high-level overview will be helpful.
Data and Views
DataWarrior is based on an important, yet as far as I can tell not explicitly-documented concept, the data set. A data set is the collection of data present in a single DataWarrior file, or within a single application window if no file has been saved. You can think of a data set more concretely as a table, where each column can contain a single type. DataWarrior supports five data types: Text; Structure; Reaction; Transformation; and Weblink. The tutorial that follows will illustrate the use of the most important types, Text and Structure.
The DataWarrior user interface is composed of one or more views. A view is a visual representation of the data set. Many kinds of view are available. The tutorial will illustrate just a few of them. Using DataWarriors consists mainly of creating and manipulating views, both individually and collectively.
Create a Data Set
Create a new data set by selecting the "New" option from the "File" menu. You'll be presented with a dialog titled "Create New File." On the right are the columns to be added. By default, DataWarrior includes one called "Structure" of type Structure. Delete it by clicking on it and then pressing the "delete" key on your keyboard. In place of the default column, add a new column called "Name" having the type Text. The new column can be added by pressing the "Add Column" button. When done, press the "OK" button.
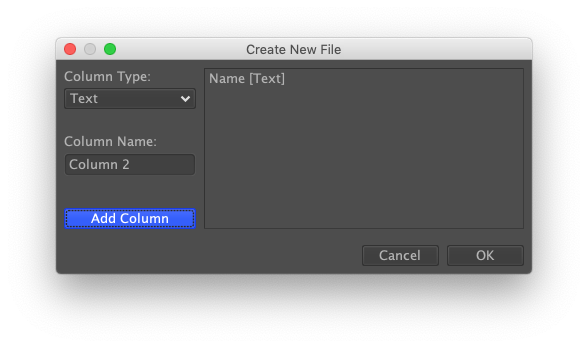
By default, DataWarrior creates two views of your data set: a Table and and a Form. The two views can be toggled by clicking the tabs in the lower-left of the screen labeled "Table" and "Form View." The latter tab should be visible. Form is useful for data entry, which is what we need to do.
Our data set will ultimately consists of both Text and Structure columns. Structures will be added via automatic conversion of the corresponding name.
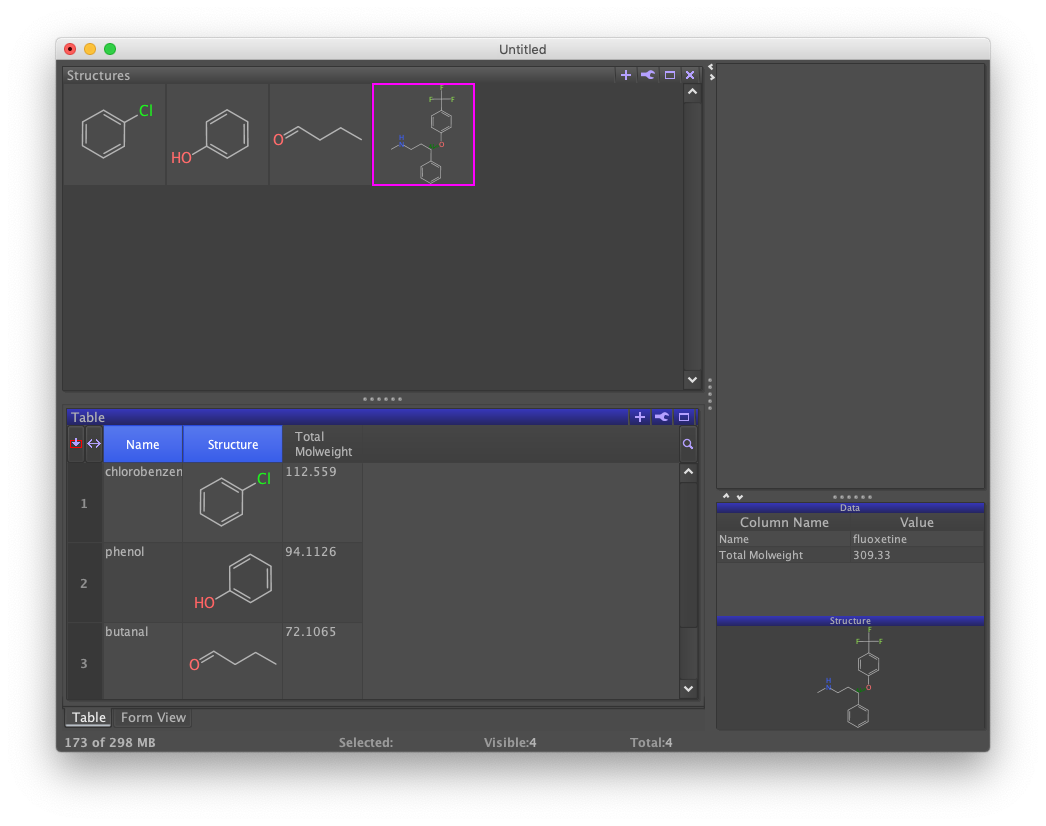
Under the heading "Name:" in Form view, enter "chlorobenzene". Click the button labeled "New Row". Repeat the process for the names "phenol", "butanal", and "fluoxetine".
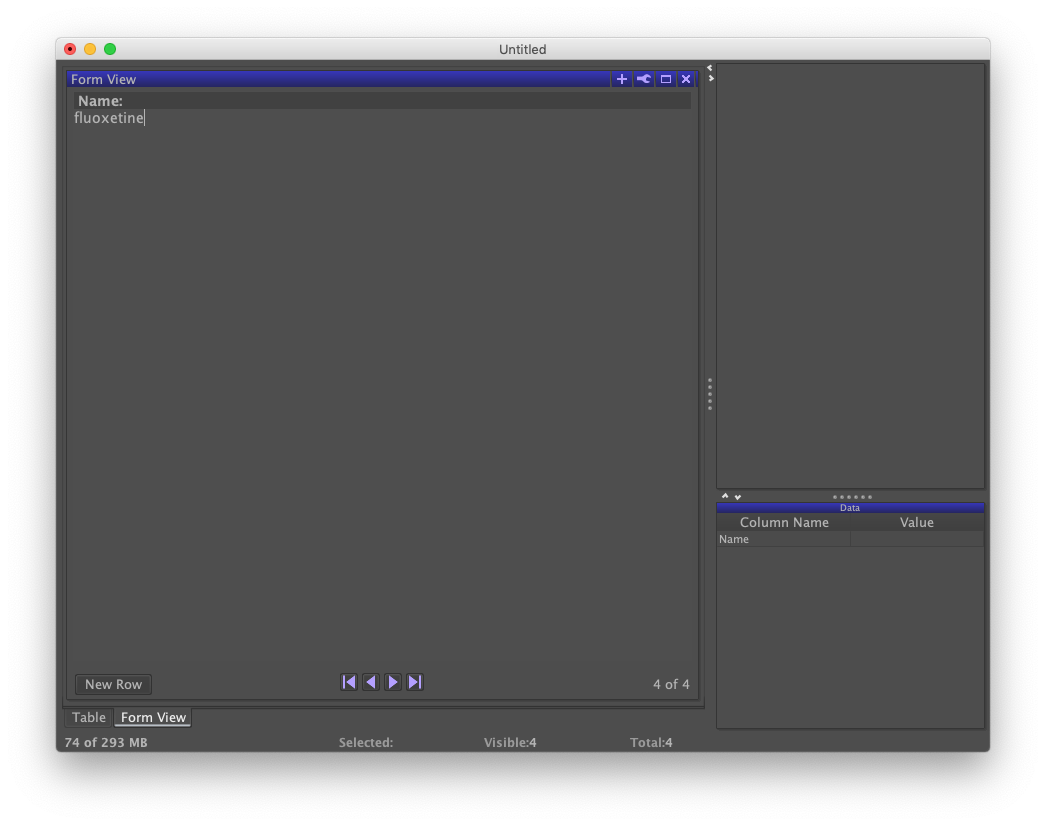
Whereas Form is helpful for viewing a single record within a data set and data entry, Table presents the data set in its entirety. Click the tab labeled "Table" to the lower-left to see a Table view.
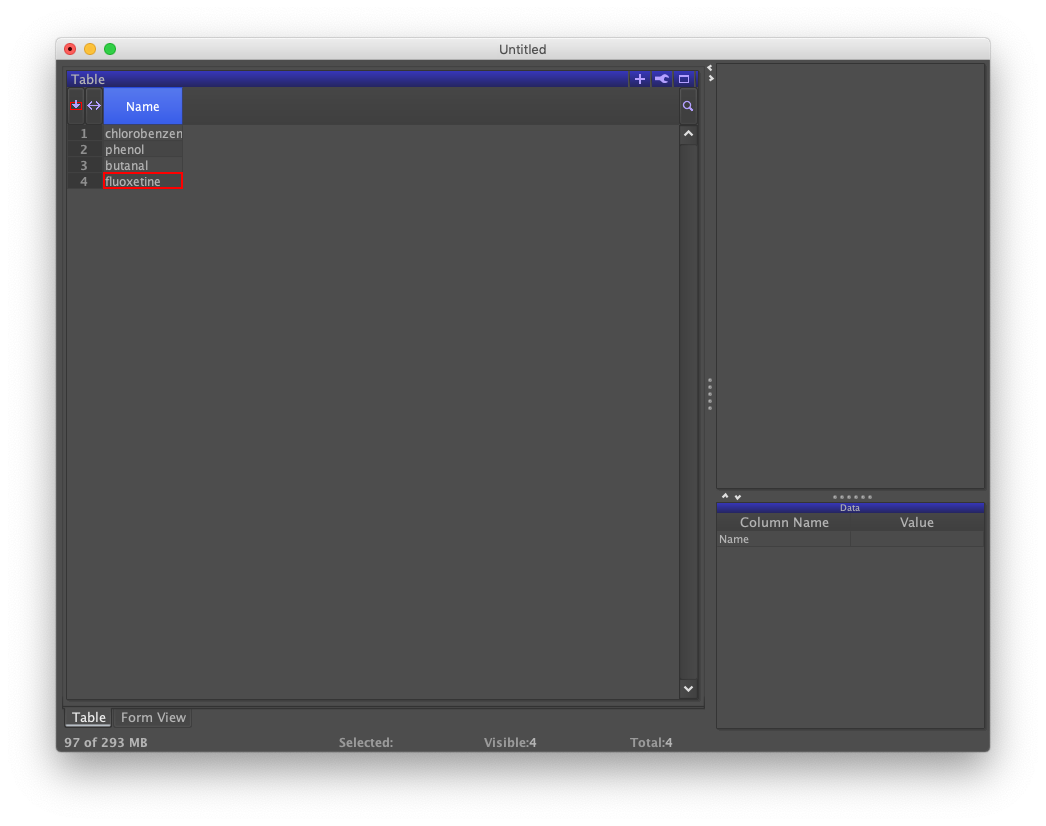
Given the four chemical names, structures can be retrieved as follows. From the "Chemistry" menu, choose the "Add Structure From Name…" option. A dialog confirms that the names appear in the column labeled as "Name" and asks for your permission. When ready, click the OK button.
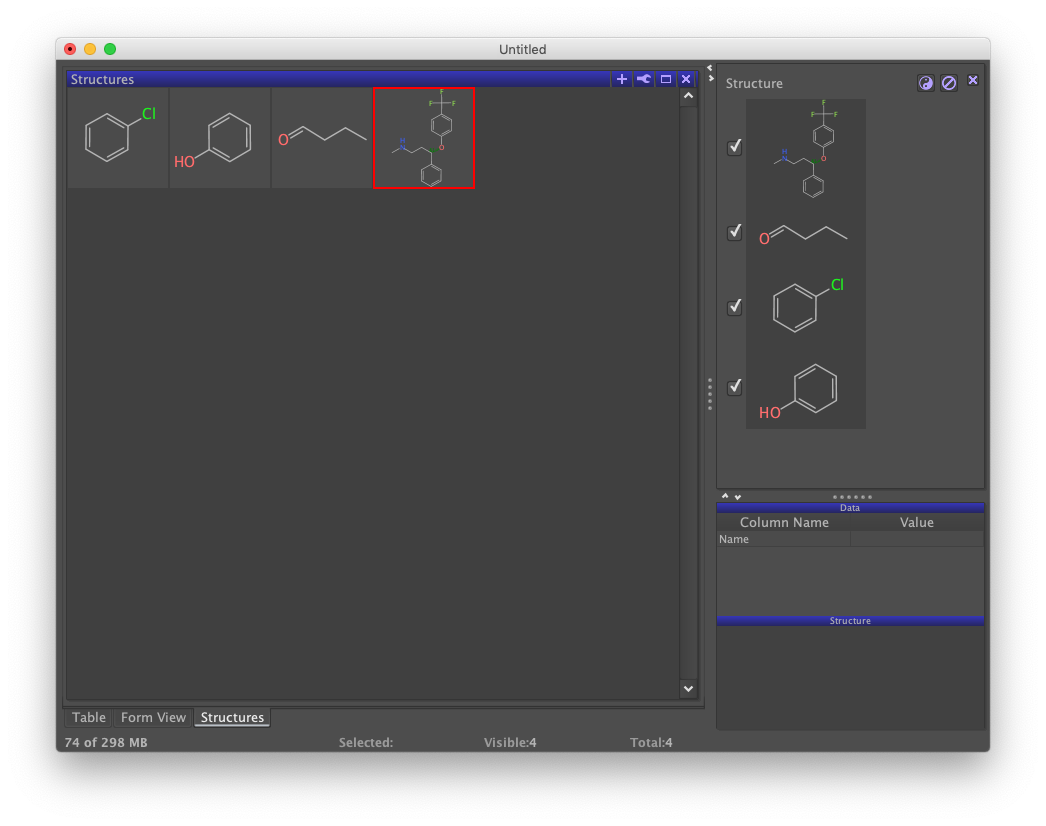
A third view labeled "Structures" should appear. Tabbing back to Table should reveal the presence of a new column containing the structures that were added. These three views each depict the underlying data set in different ways. Form does not yet show structures because its design doesn't yet support it. Although not detailed here, the design can be updated by clicking on the wrench icon in the upper-right of Form view and selecting the "Design Mode" option.
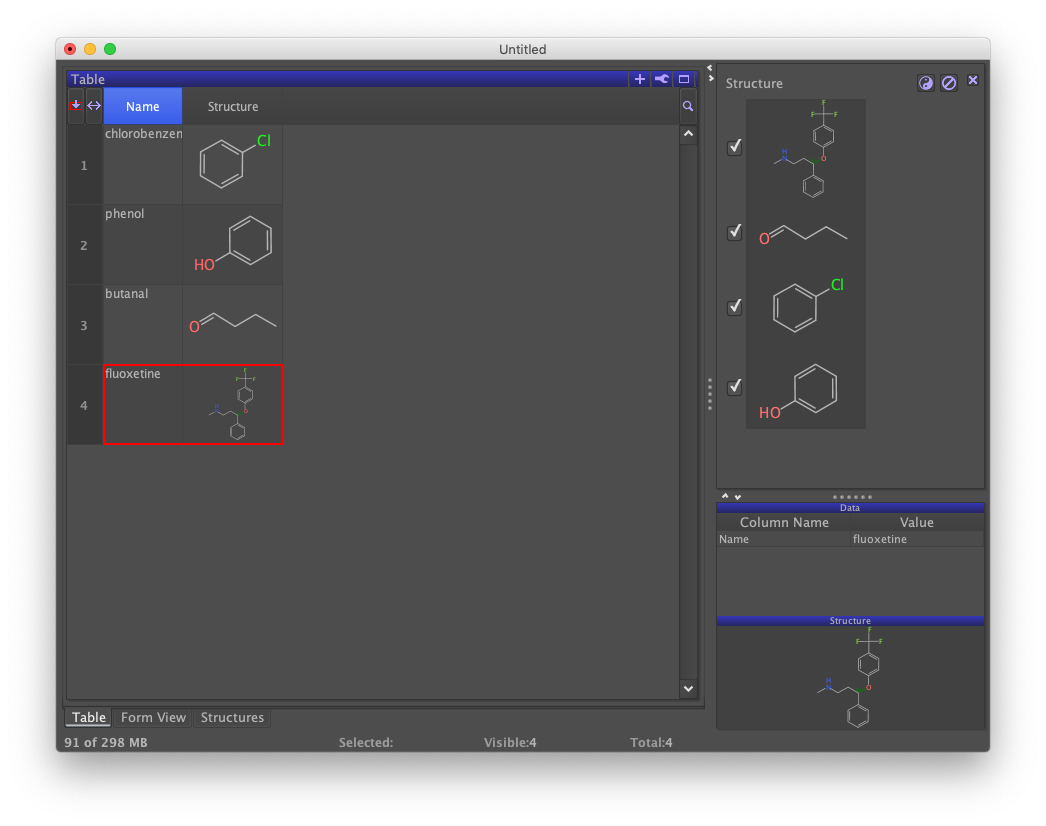
Compute a Property
DataWarrior supports a number of molecular property calculations. These can be inspected by choosing the "Chemistry" menu and then the "From Chemical Structure" submenu.
Let's add molecular weight. From the "Chemistry" menu, select the "From Chemical Structure" option. Then select "Calculate Properties…". A tabbed dialog should appear, with one tab labeled "Druglikeness". Check the box labeled "Total average molweight in g/mol". Notice that DataWarrior has deduced that the structure data reside in the column labeled "Structure". Should multiple columns of type Structure be present, one of them could be selected instead. Finally, click the "OK" button.
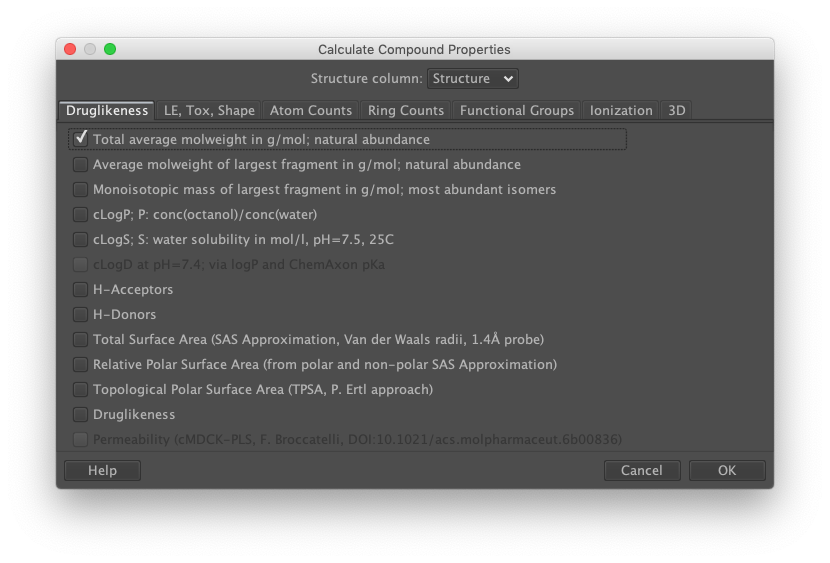
A new column labeled "Total Molweight" has been added to the data set and populated with computed molecular weights.
Filter
For the small data set created in this tutorial, all rows can easily be viewed at one time. However, you'll often want to restrict the rows that are visible in various views — without deleting them. This can be accomplished with a filter.
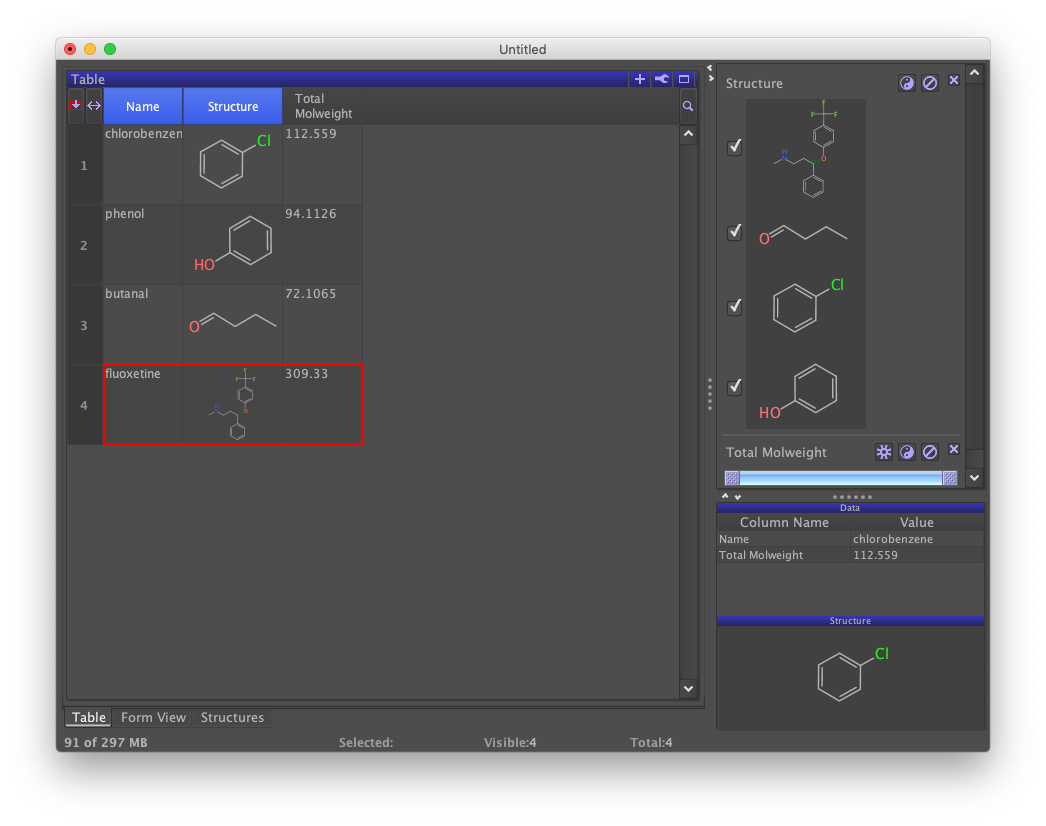
You may have noticed that a new panel labeled "Structure" appeared to the right just after generating structures from names. This is a filter. A checkmark indicates that the row containing the structure is visible. All structures are checked, so all rows are visible. However, if you uncheck one of the structures, notice that the corresponding row disappears from the table. This does not delete the row, just suppress its display. This suppression applies across all active views.
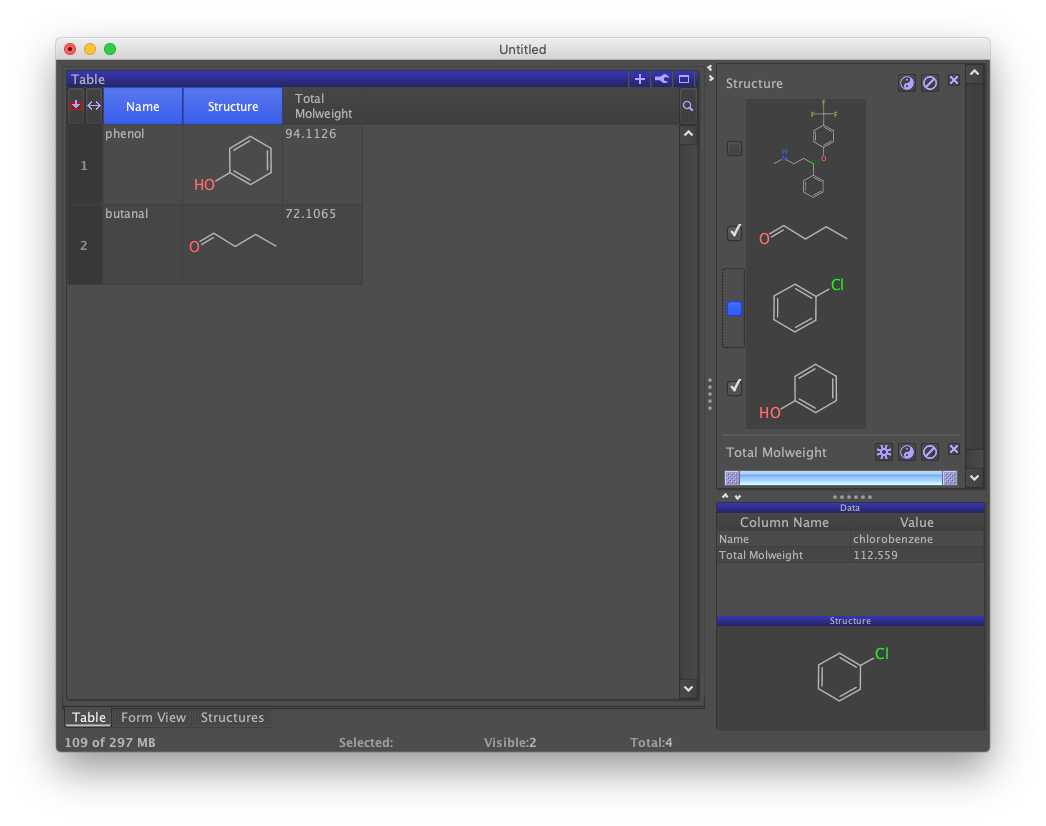
A second filter labeled "Total Molweight" should appear to the right below the "Structure" filter. Moving the slider bars renders those rows whose molecular weights fall outside of the range invisible.
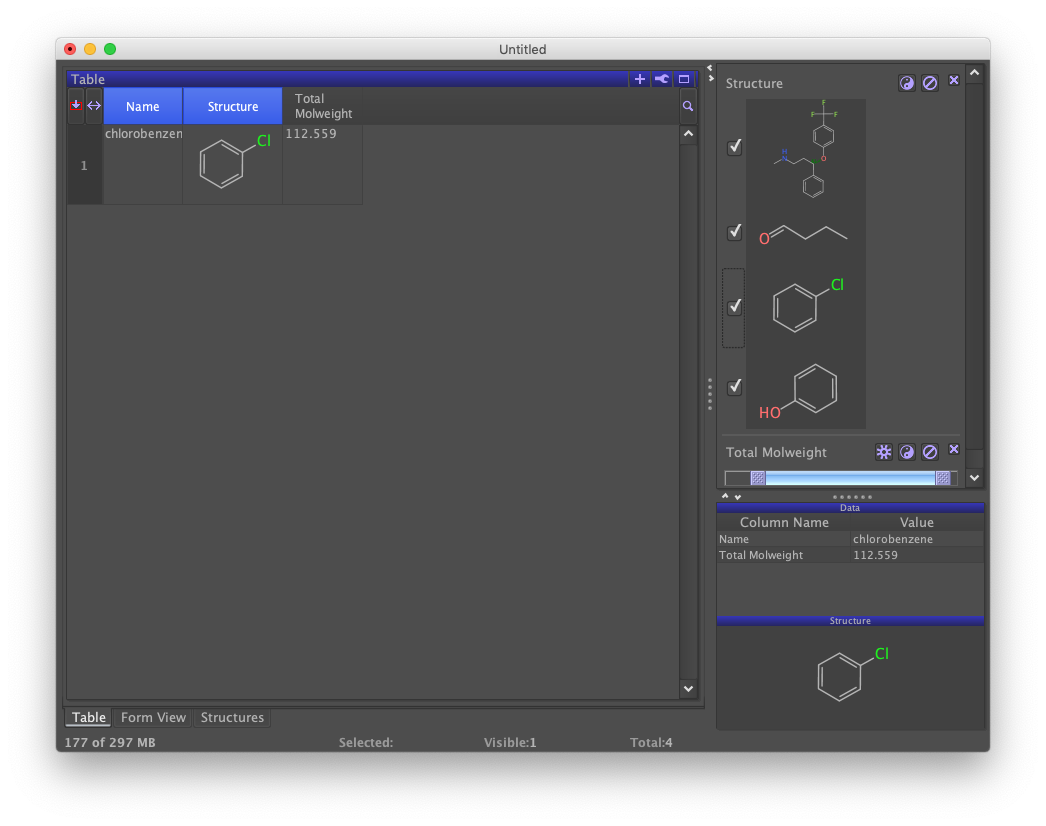
The slider bar is scaled to the range of values in the column being filtered. The left slider sets the lower limit and the right bar sets the upper limit. Suppressing all rows requires both sliders to be moved. Different filters can be used together. Notice the effect of checking and unchecking the "Structure" filter while sliding the "Total Molweight" filter.
Filters that are no longer needed can be dropped by clicking the "X" to the upper right. Drop both of the auto-generated filters by clicking on their "X" buttons. All records in the data set should be displayed in the table view and there should be no filters on the right-hand panel.
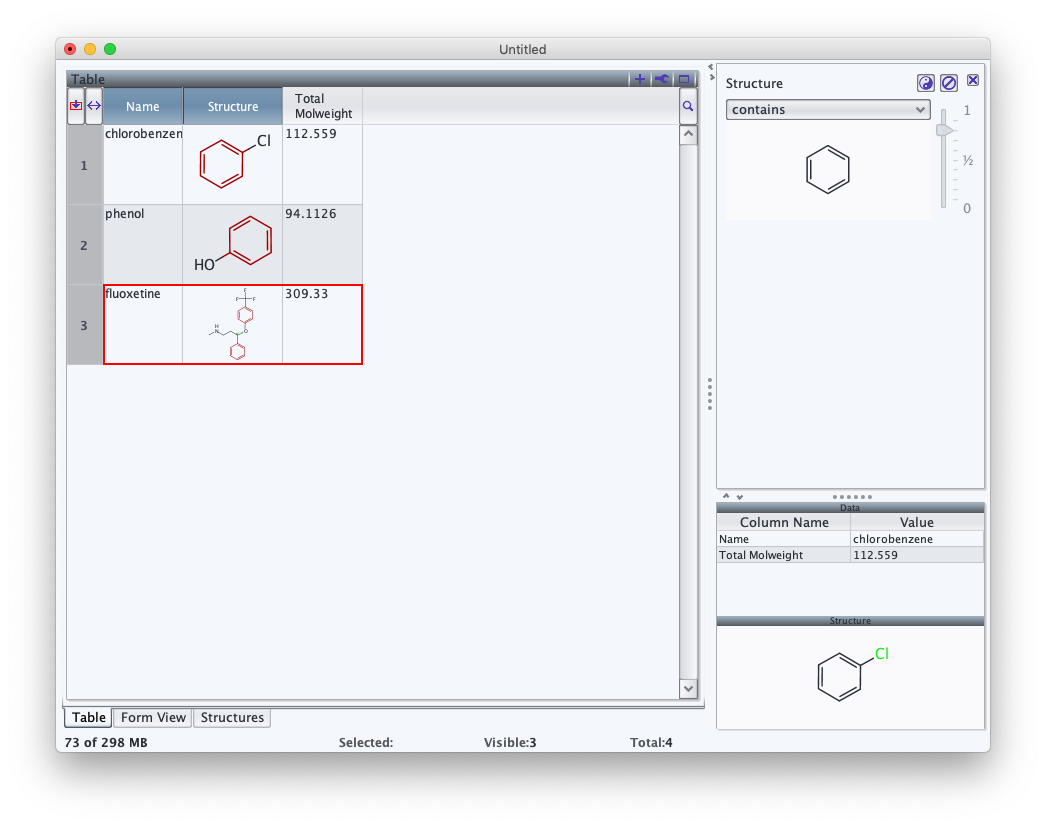
Let's manually add a structure filter. Instead of checkboxes, however, this time we'll add a substructure filter. From the "Edit" menu, select the "New Filter…" option. Several filters are presented, their names reflecting the name of the column holding the data and the type of filter in brackets. Select the one labeled "Structure [Structure]" then click "Ok".
To use this filter, double click on the area labeled "<double click or drag & drop>". A structure editor will appear. Draw a benzene ring, then click "OK". Records whose structures do not contain the substructure in the filter will be excluded from all views. In this case, one structure is excluded. To see which one, disable the filter by clicking on the circle-slash button to the upper right. Both substructure and similarity filtering are supported. To change the filter mode, use the pulldown at the top of the filter, and the slider to the right to set the desired level of similarity.
Arranging Views
Tabs are just one way to organize DataWarrior views. They can also be placed side-by-side for simultaneous viewing.
For example, to display the Structures view above the Table/Form view, click on the Structure tab. Then drag the blue bar into a new position. Both horizontal and vertical splits are supported. Dragging a split view over another view regenerates the tab layout.
Extensions
The tutorial presented here, although illustrating key concepts, only scratches the surface of what DataWarrior can do. The forums and user manual are good starting points for further exploration, as of course is the DataWarrior user interface itself. I suspect that future articles here will tackle special advanced topics.
Those who use notebooks and data flow tools may wonder about automation and custom tasks. Macros offer one approach to automating built-in DataWarrior functionality.
What about custom functionality? To my knowledge, there is no plugin API that would allow a competent Java developer to build new view or filters, or add new data types. The topic has come up on the forum but nothing appears to have resulted from it.
Two kinds of third party extension I've seen so far may illustrate the scope of plugin support that now exists:
- a "ChemAxon plugin" (license required) implements a pKa and clogD calculations, and possibly others as well.
- A handful of online data collections can be searched, including Enamine, ChemSpace, and Crystallography Open Database. This functionality appears to be enabled through a database access API.
If your extension queries a database or computes a property, then DataWarrior may offers some kind of plugin support. Otherwise, extending functionality may require an exploration of the source code. The cheminformatics functionality is based on openchemlib.
Conclusions
DataWarrior is a powerful, free application for viewing and manipulating data. Chemical structures are supported natively, making the program suitable for a wide range of tasks likely to be important in chemistry research. The program is straightforward to use given an understanding of some basic concepts. DataWarrior supports a number of advanced features not described here, and developer support for certain kinds of extensions appears to be built-in. More sophisticated extensions could be built by adapting the source code.