Rethinking the Chemical Reaction as a Graph: Imaginary Transition Structures and Beyond
Cheminformatics concerns itself with two entities: molecules and reactions. A molecule embodies chemistry's static nature, whereas a reaction embodies the dynamic. Although there are important problems to solve on both sides, cheminformatics tends to focus on molecular tools over reaction tools. One reason is complexity. Reaction tools require solutions to all of the problem required by molecule tools, and then some.
Then there's graph theory. For 150 years, theoretical chemistry and later cheminformatics have reaped the benefits of close ties with this branch of mathematics. An obvious relationship between the two fields presents itself: in a molecule, atoms map to nodes and bonds map to edges. Algorithms and proofs from graph theory are applied to molecular problems. Likewise, molecular problems inspire graph theory. The crossover continues to this day. Reactions, on the other hand, don't align in such an obvious way. Although reaction networks, where nodes map to molecules and edges map to transformations can be built, this approach presents several challenges.
What if reactions could be formulated more like molecules? That was the premise of a series of papers from the 1980s.
Arrow Notation
Arrow notation depicts a chemical reaction with the head pointing away from starting materials and toward products. This convention, which dates back to at least 1757, is still used today. In modern notation, catalysts and excess reagents often appear above the arrow, with time, temperature, and solvent below.
Cheminformatics tools have for the most part adopted arrow notation. For example, Daylight documentation explains how to use the greater than (>) symbol as a reaction arrow. Other examples can also be found, including the MDL RXNFile format.
The Problem with Arrow Notation
Easily understandable and ubiquitous though it may be, arrow notation drags some baggage into the cheminformatics arena. Problems include:
- Repetition. Non-participating atoms and bonds are duplicated on both sides of the arrow.
- Hypergraph. A single reaction maps potentially many reactants to many products. If molecules are nodes in a reaction graph, then a reaction arrow maps to a hypergraph edge. Graph manipulation procedures often explicitly disallow such graphs.
- Atom mapping. We usually want to correlate an atom or bond in the starting material with one appearing in a product. Arrow notation requires a secondary mapping system.
- The above complexities make it difficult to re-use standard graph-based computational methods such as cycle perception, traversal, and isomorphism detection.
The result is two disconnected cheminformatics software stacks: one dealing with molecules and the other dealing with reactions. The division can be seen from the bottom software layer (the cheminformatics toolkit) all the way to the user interface (structure vs. reaction editors). Attractive though it may be in the beginning, arrow notation unnecessarily fragments the code base.
Imaginary Transition Structures (ITS)
In 1986, Shinsaku Fujita proposed an alternative to arrow notation. His approach, Imaginary Transition Structures (ITS), viewed reactions as "an extended kind of chemical structure." This system encodes reactants, products, and atom mappings within a single, undirected, connected graph.
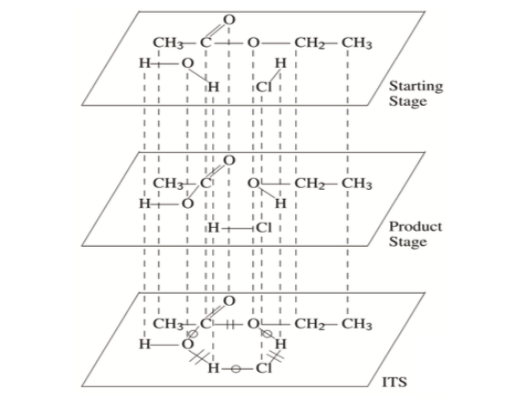
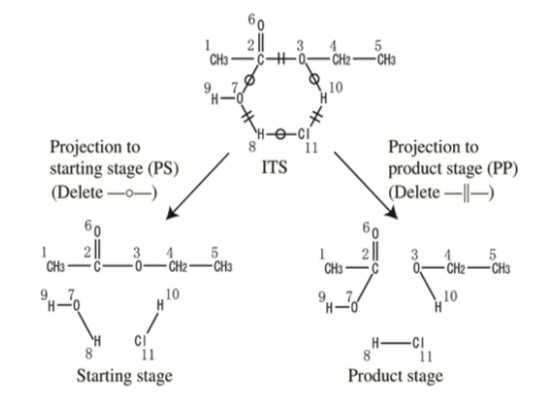
Consider the acid-catalyzed hydrolysis of ethyl acetate. Here, two reacting species (ethyl acetate and water) produce two products (ethanol and acetic acid). Hydrogen chloride, serving as a catalyst, appears on both sides. The arrow notation for this reaction is:
CH3CO2CH2CH3 + H2O + HCl → CH3CO2H + CH3CH2OH + HCl
An ITS for this reaction could be encoded as follows. First, create a starting graph S as the sum of all reactant molecular graphs. Next, create a products graph P as the sum of all product molecular graphs. Finally, sum these two graphs to create a third graph, which will contain all nodes and edges in the reaction. Label each edge according to whether the reaction creates, breaks, or leaves unchanged the corresponding bond. The resulting graph is an ITS.
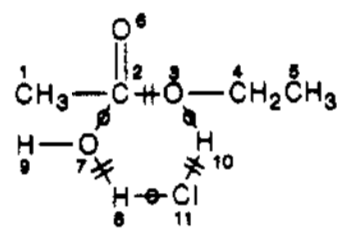
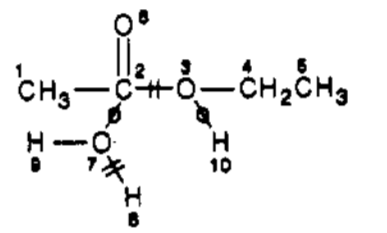
Catalysts can optionally be omitted. If they are, the result is an abbreviated ITS. The abbreviated ITS for ethyl acetate hydrolysis can be represented as:
The edges in an ITS graph ("ITS bonds") are classified according to their role in the corresponding reaction:
- an in-bond is formed by the reaction;
- an out-bond is broken by the reaction; and
- a par-bond is preserved by the reaction.
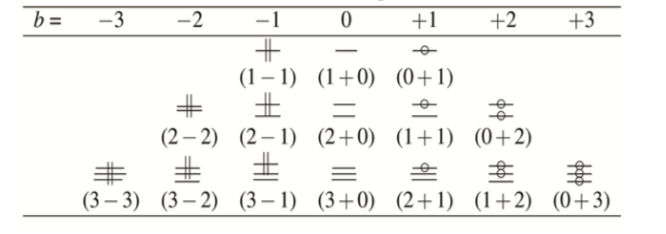
Within a data model, ITS bonds are labeled with an ordered pair of integers (a, b). The first member a denotes the bond order at the start of the reaction. The second member b denotes the change in bond order caused by the reaction. For example:
- a single par bond (unchanged by the reaction) would be labeled as (1, 0);
- a single in-bond (formed by the reaction) would be labeled as (0, +1);
- a single out-bond (broken by the reaction) would be labeled as (1, -1).
- a double bond reduced during a reaction would be labeled as (2, -1).
And so on. Summing a and b yields the bond order in the product. Given a molecular graph with three possible bond orders (1, 2, and 3), the possible ITS graph edge labels, and the proposed visual representation, are:
As originally formulated, ITS does not capture formal charges consumed or produced during a reaction. For example, the reaction of trimethylamine and methyl iodide has the following arrow notation:
(CH3)3N + CH3I -> (CH4)N+I-
The formal charges produced by the reaction will not be captured by an ITS. The same applies to stereochemistry. A follow-up paper offers comprehensive solutions to both problems. A simpler approach, in which ionic bonds are modeled as edges in the ITS graph is also described.
ITS transforms the problem of reaction manipulation into one of graph manipulation. As such, we get a number of useful features essentially for free.
Regenerating Reactants and Products
An edged-labeled ITS can be used to regenerate either the set of reactants or the set of products through graph manipulation. Fujita describes two processes:
- Projection to starting stage (PS). Extract all nodes in the ITS graph as atoms. For each edge label (a, b) in the ITS graph, add a bond of order a. The result is a molecular graph in which each connected component is an input to the reaction.
- Projection to product stage (PP). Extract all nodes in the ITS graph as atoms. For each edge label (a, b) in the ITS graph, add a bond of order a + b. The result is a molecular graph in which each connected component is an output from the reaction.
Graph of Reaction Centers
As sophomore organic chemistry students are taught, molecules can be classified by the functional groups they contain. Viewed from the perspective of graph theory, a functional group represents a subgraph over one or more molecular graphs. Functional groups in turn provide a wealth of insight into reactivity and other physical properties of the molecules containing them. Learning how one functional group behaves lets you say a lot about an unknown molecule in which it appears.
We can likewise glean valuable information by looking at ITS subgraphs. An important example is the reaction center graph (RC graph). An RC graph is a subgraph of an ITS containing only dynamic nodes and edges. An edge is dynamic if it: (1) represents an in-bond; (2) represents an out-bond; or (3) lies between two dynamic nodes. A dynamic node is incident to at least one dynamic edge.
As an example, the RC graph of ethyl acetate hydrolysis catalyzed by hydrogen chloride can be drawn as follows:
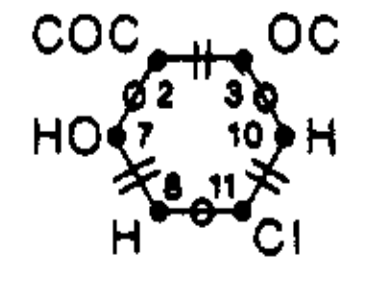
We can think of an RC graph as the reaction analog of the functional group. Like molecules sharing a common functional group, ITS graphs sharing a common RC graph are likely to behave similarly and share similar characteristics.
Graph theory provides powerful tools for further analysis of RC graphs. Consider how the edges of an RC graph alternate between in- and out-bonds. The RC graph of ethyl acetate hydrolysis drawn above consist of a single cycle in which edges alternative between being formed (in-bonds) and broken (out-bonds).
Fujita refers to an alternating sequence of in- and out-bonds in an RC graph as a string. He goes on to classify reactions according to the number of strings they contain ("stringity"). A string will always occur over a cycle, however an abbreviated ITS can produce acyclic strings. A reaction containing multiple strings can sometimes be thought of as occurring over multiple steps. For example, condensation reactions such as ketalization, esterification, or imine formation produce bicyclic RC graphs in which two strings can be traced.
Although not mentioned in his original work, what Fujita is describing can also be cast in terms of the graph theoretical problem of perfect matching. A matching is a subgraph in which every node has degree one. Matchings can be classified as maximal, maximum, or perfect depending on coverage. A perfect matching contains all the nodes of its supergraph.
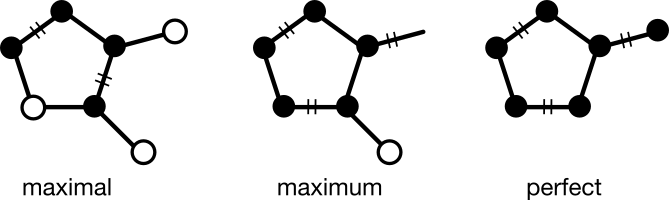
It turns out that every valid RC graph, whether cyclic or acyclic, has a perfect matching over in- and out-bonds. Organic chemists would recognize the striking similarity to "pushing electrons" in an aromatic system or within a reaction mechanism.
The requirement for a perfect matching over the dynamic bonds of an RC graph can be applied in several ways. For example, we can use it to validate arbitrary reactions. Alternatively, we can use it to invent new reactions.
Rethinking the Chemical Reaction as Graph
The graph-based model of reactions afforded by ITS offers several opportunities not available through arrow notation. Some of them include:
- Classification. An ITS can be classified by graph invariants including cycle count, cyclomatic complexity, edge count, and node count.
- Validation. A valid ITS must contain a perfect matching over dynamic edges.
- Invention. Which valid RC graphs have never been reported as reactions in the literature? What do they have in common?
- Storage/Retrieval/Indexing. Molecular fingerprints have been used for decades to index molecules and define similarity relationships. All of the same analysis work with ITS graphs.
- Editing. Molecules and reactions can be edited using the same compact tool.
- Depiction. The redundancy of arrow notation results large depictions in which atom/bond mapping isn't always obvious. ITS depictions approach the compactness of chemical structures while explicitly and accurately representing reactant/product mapping.
Machine Learning
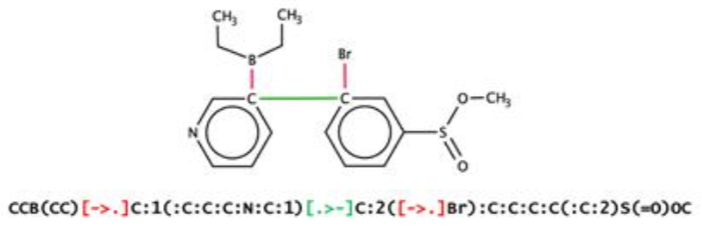
An intriguing recent development in the use of ITS-style reaction graphs comes by way of machine learning. A group led by Varnek recently described the discovery of novel reactions using a representation similar to Fujita's ITS. Varnek's publications refer to the ITS concept as a Condensed Graph of Reaction (CGR).
The technique, called "SMILES/CGR" extends SMILES so as to capture dynamic bonds. In-bonds and out-bonds are represented using a new bond notation wrapped in brackets. For example, a single bond broken in a reaction would be represented as [->.]. A single bond formed by a reaction would be represented as [.>-]. A double bond reduced to a single bond in a reaction would be represented as [=>-], and so on.
Combining this notation with the now common approach of SMILES-based autoencoders lead to several reactions not present in the training set.
The Varnek group has produced a substantial body of work applying reaction graphs to a diverse array of problems:
- A Representation to Apply Usual Data Mining Techniques to Chemical Reactions — Illustration on the Rate Constant of SN2 Reactions in Water Modeling rates of reaction.
- Assessment of tautomer distribution using the condensed reaction graph approach Modeling tautomer distributions as reaction graphs.
- Automatized Assessment of Protective Group Reactivity: A Step Toward Big Reaction Data Analysis Protecting group removal recommendations via reaction graphs.
- Expert System for Predicting Reaction Conditions: The Michael Reaction Case Predicting reaction feasibility. No difference between reagent-based descriptors and reaction-based descriptors.
- Mining Chemical Reactions Using Neighborhood Behavior and Condensed Graphs of Reactions Approaches Similarity-based virtual screening.
- Models for Identification of Erroneous Atom-to-Atom Mapping of Reactions Performed by Automated Algorithms. Validation of mappings made by other tools.
- Prediction of Activity Cliffs Using Condensed Graphs of Reaction Representations, Descriptor Recombination, Support Vector Machine Classification, and Support Vector Regression A pair of molecules can be modeled as a transformation and so condensed graph can be used.
At least two software packages created by Varnek group associates have been released as open source. CGRTools is a toolkit for working with reaction graphs. CGRdb is a reaction database organized around reaction graphs.
Conclusion
Imaginary Transition Structures, and more broadly reaction graphs, offer a powerful abstraction for working with reactions. By encoding starting materials, products, and atom/bond mappings in a single graph, reaction analyses can take advantage of the same techniques developed for molecular graphs over the last 50 years. The appearance of the first study combining machine learning autoencoders with reaction graphs may foreshadow a renaissance in reaction cheminformatics, with reaction graphs leading the way.