Planes, Trains, and Organic Syntheses
Riders of commuter trains are accustomed to using maps like those produced by the London Underground:

These maps are capable of condensing large amounts of information into a useful package. Transit map representations, known more generally as graph or network representations, are especially good at revealing the big picture, although their applications are numerous and can be found these days just about anywhere you find large datasets.
All Aboard
Organic synthesis has proven itself an excellent fit for graph modeling, depiction, and analysis approaches. For example, in 2012 a team led by Bartosz Grzybowski showed how graph analysis of the entire set of known reactions could be used to predict then-unknown one-pot reactions. This research was used in building a software system called Chematica:
The Places You'll Go
More recently, a study from John Proudfoot at Boehringer Ingelheim described a graph-based visualization system for multistep organic syntheses. Focusing on a single target, strychnine, Proudfoot asks what can be learned by depicting synthetic routes uniformly, as networks.
As a relatively simple case, consider Woodward's synthesis:
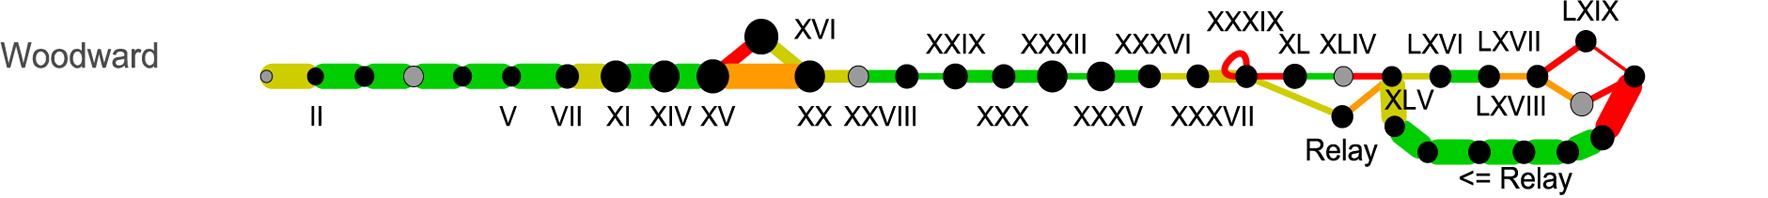
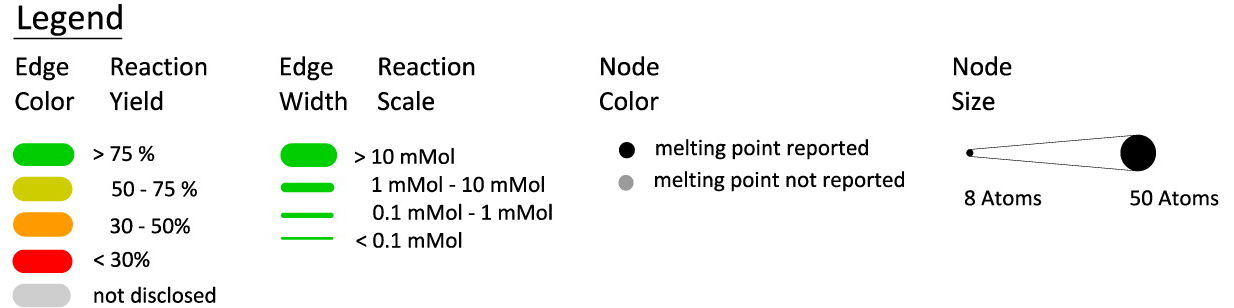
This representation makes it easy to spot some important overall features of the synthesis: (1) it's highly linear; (2) advanced intermediate "XLV" was mainly produced from multistep degradation of morphine itself ("relay synthesis"); and (3) melting point determination was used extensively as a characterization method.
What can be learned by comparing synthetic routes from multiple labs? Between 1954 and 2012, several total syntheses of strychnine were reported. One of the more useful visualizations lays out each synthesis such that common intermediates share common nodes (circles) and are joined by a dark black line:

Each team took a significantly different initial approach to strychnine, leading to a handful of common intermediates near the completion of each synthesis. If this were the transit map of a city, visitors would likely notice a distinct trend toward suburban sprawl.
Clearly, graph-centered perspectives can lead to fundamentally new insights not readily available with other methods of data analysis. A few possibilities are discussed in the paper.
It's not too hard to imagine how similar analyses applied to other molecular targets (possibly incorporating biosynthetic routes, patent data, or other information) might yield many fruitful avenues for exploration. I wonder how many important discoveries in organic synthesis, hiding in plain sight, might be uncovered through a focused program of graph visualization and automated analysis.
Why the Subway Smells
Proudfoot's study made extensive use Cytoscape, an open source software platform for graph visualization. As a result of Cytoscape's biology focus, relatively little tooling exists for chemistry applications such as those described in the Proudfoot paper. As noted in the conclusion:
Although one goal of this exercise was to develop a process for network representations of reaction sequences that is less time consuming than those reported earlier, we cannot categorically state that this has been achieved. The layouts shown above required sustantial modification of the defaults available in Cytoscape in order to achieve representations reflective of the style of standard reaction sequences.
Probably far more time consuming, however, was the manual compilation of reaction data from the primary literature. These data exist as semi-structured tables and narratives often scattered between supporting information sections and the main paper.
One of the more generally useful outcomes of the study was the identification of a set of reaction properties that, when combined for each step in synthetic sequence, could be used to generate network diagrams. These properties are defined in the raw dataset.
Still, I shudder to think at the time it must have taken to compile and check that dataset in the first place. In what can only be described as an idea whose time has come, Proudfoot hints at what might be possible if chemistry could standardize its reporting of reaction scheme data:
Because reaction maps such as those represented here require a highly curated basis set, perhaps a standard format for reporting reaction information should be adopted. For example, a format analogous to Table 1 with the addition of fields for reactant and product structure (INCHI or SMILES representation) applied in a consistent way could allow the automated combination of reaction information across different sources without the need for manual data extraction and extensive curation.
Amen.