Similarity-Potency Trees
A colleague has just sent you a 500-record SD File containing structure-activity relationships (SAR) that you've never seen before. What are the first steps you take to begin to make sense of it?
The approach a medicinal chemist would take might involve:
- opening the file in a chemical spreadsheet
- sorting the records by potency
- compiling a series of reports derived from substructure or similarity searches
- printing the entire dataset for offline browsing and note-taking
- using one or more of a variety of multidimensional plotting tools to spot trends and outliers
If you talk to ten medicinal chemists, you might get ten different opinions on the utility of the activities listed above. Although this problem is best framed in the context of new datasets, aspects can be seen at every stage of a drug discovery program.
Surprisingly, there aren't a lot of good tools for dealing with this problem.
Similarity-Potency Trees
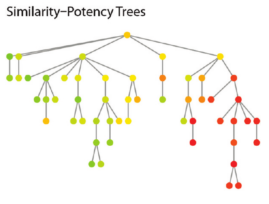
A recent publication from Wawer and Bajorath introduces an intriguing solution. The Similarity-potency tree (SPT) is both a new visualization technique and a new data structure specifically designed to help chemists quickly identify and interactively build mental models of complex SAR. Here's an example, taken from the publication:

Each node (dot) represents a structure and its associated data point - a binding assay result, for example. An edge (line) between two nodes means that the two underlying structures are similar enough to meet a pre-determined cutoff.
The root node (top) of the tree represents a structure-potency pair chosen at random from the dataset. Structural similarity to the root node decreases in the downward direction. In other words, the further down a node appears, the less structural similarity is shares with the root structure.
For a given parent node, potency of its children increases from left to right. Because each node is color coded according to absolute potency, the children of each node tend to take on the appearance of a rainbow in those instances in which deep SAR can be found.
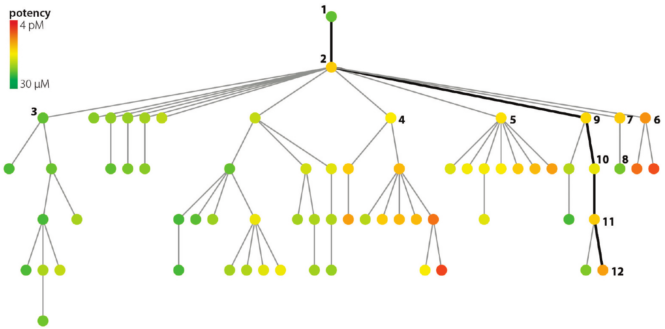
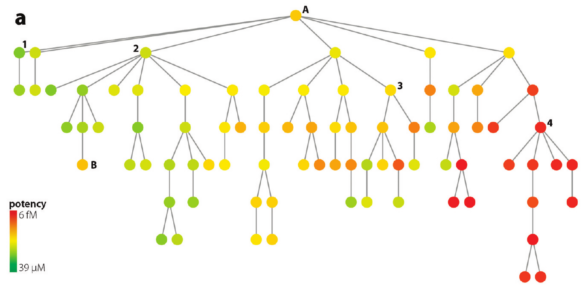
Although this analysis may not appear on face value to offer much, consider the two cases below:

Although overall the data show relatively few actives, comparing the structures each of the two or three red nodes with its immediate parent could give key insights for making more potent compounds. Likewise, the SPT offers a well-defined path to trace how potency increases (or decreases). SPTs don't generate SAR models, but they appear to be useful tool to help chemists quickly deduce them.

In contrast, to the previous tree, this one above shows many active compounds to the right (near "4"). Despite big structural differences, all of the compounds in this grouping maintain high potency. The SAR is flat. This insight was gained by doing nothing more than inspecting a simple 2d diagram.
Software
A Java-based tool for building Structure-Potency trees is available for download. I was able to run the software on my OS X system using the following command (note the required output filename):
java -jar spt.jar sampleInput.sdf out.txt
Industrial Interest
In a recent presentation, Lisa Peltason of Hoffmann-La Roche described the company's efforts to integrate SPTs into an in-house tool called SAR Analyzer.
Conclusions
There's a lot more to SPTs than what's been presented here, including a method for scoring them to provide the best starting points for further analysis. Although the examples I've seen with small datasets are interesting, I'm curious about how usability holds up with thousands of datapoints. Although SPTs are simple in concept, the practical utility of SPTs will likely depend on the availability of good user interfaces.