Follow the Money: American Chemical Society Income at a Glance

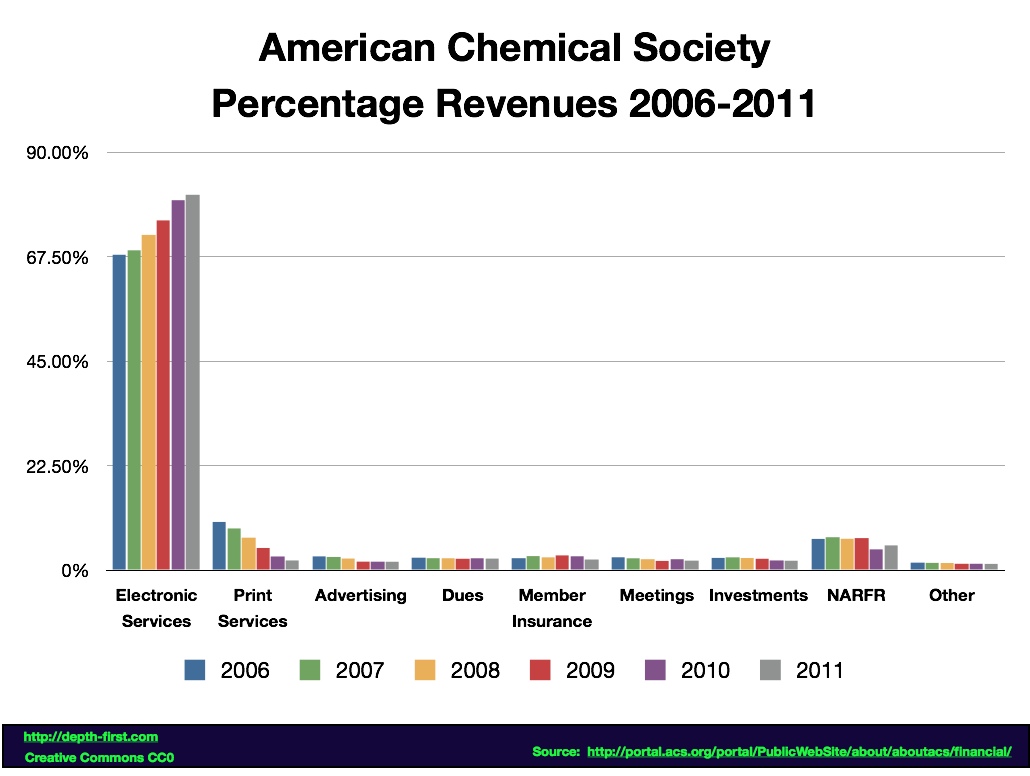
The chart above was compiled from American Chemical Society (ACS) audited financial statements for the years 2007-2011.
Regardless of how you view ACS, one thing is undeniable: "Electronic Services" are a huge and growing part of the annual ACS income.
The graph above is shown in percentage terms. To give some perspective, total ACS revenues in 2011 stood at $499.8 million. Electronic services made up 81% of that total, or $403.8 million. Even if ACS were forced to pay the entire $40 million being contested in the recently-decided ACS v. Leadscope Ohio Supreme Court case (which it probably won't), that liability would only be 10% of annual revenues from Electronic Services.
The signficant rise in revenue share from electronic services was not suprisingly matched by a corresponding decrease in the relative share of "Printed Services" over the 2006-2011 period.
"NARFR" (Net Assets Released from Restriction) makes up the second largest portion of ACS income today and is a type of account used by non-profits for donations. However, at just over 5% of ACS 2011 income, this is a relatively minor component at best.
Perhaps most surprising about this graph is the relatively paltry income from member dues and meetings (2.5% and 2.0% of 2011 income, respectively). This is surprising because for many ACS members, meetings and dues are major points of interaction with the organization representing them. That these activities matter so little to the ACS top line seems odd.
Find the source of money in an organization and you'll probably find its power. Although that line of thinking may or may not apply in the case of ACS, anybody wanting to truly understand this organization would do well to begin by asking questions about "Electronic Services".